 The swarm of cracks just looks nice to me.
Thoughts from a Recreational Physicist
The swarm of cracks just looks nice to me.
This is one of the sites that got me back into blogging.
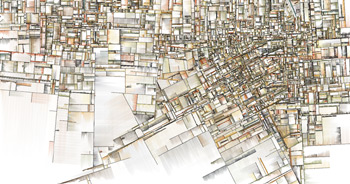
Complexification
I’ve been trying to put my finger on what I really enjoy about this collection. To start with, the drawing algorithm used throughout the site is extremely pleasing and has a real organic feel to it. The peaceful and relaxing palette doesn’t hurt either.
The first few images really stand out and look meticulously hand drawn. As I go back and look through the site, I am continually amazed at the differences in the different series and how well they are drawn together through the artist’s brush.
While the pictures themselves are beautiful, I love that the algorithms are public as well, and that these images are all algorithmically generated. It’s neat to see things like sorting algorithms visually represented, but even more beautiful when the code expresses it’s inner beauty through a canvas.
 I just like this one!
I’ve had this sitting on my computer for a while and thought I’d publish it rather then just leave it sitting there. This simulates a pulse of light expanding out like my compression wave examples. This time however, we are looking at a pulse of light expanding in the vicinity of a black hole. Rather than expanding out in a circular wave pulse, it wraps around the hole and circles back to the original location traveling around the hole forever.
I’m still trying to wrap my head around what this implies. Most General Relativity texts cover light cones tipping over at various distances from the black hole, and particular light paths including distances where light orbits the hole. The code is pretty rough and ugly right now, but is a fun little application of solving differential equations in javascript.
With the focus I’ve had on finishing out some of the fractal rendering code on the site, I’ve been going back and looking at some of my earlier stuff like the animated fractal demo. (This is not just a gratuitous link to some of my old demos, trust me) I’ve been leaving it open on my second monitor while I work, and it reminded me how much I like the motion.
The functions defining these images consist of 3 parameters: a central point, a rotation angle and a scale factor. My first attempts at making these things fly across the screen involved varying the position, angle and scale factors sinusoidally with random periods. It got the images moving and if you waited long enough, it was guarantied to trace out a significant volume of parameter space. However, it just ended up looking like it was constantly spinning and slowly changing shape.
My next step was to interpolate between randomly selected points in parameter space, which worked to make the motion more interesting, but it still would shrink to a point whenever it got too close to the origin and the scale factors were too small. Adding a constraint to the motion to put a minimum bound on the scales ended up fixing it and giving it the current zoomy, swooshy feel it has to day. That and adding a random factor to the time between random points along with a random pause at the point.
I use the same algorithm, with 3 dimensional fractals in the 3d bubbles demos here and here. Man, I just loaded the three.js version for the first time in a few months, and it is really fast with the latest version of chrome.
Now that I have some more experience at solving differential equations in Javascript, it might be fun to model the changes with a repulsive force at the origin and fade in attractive points at each of the destinations.

Work in progress…

We’ve all seen galleries or videos of zooming into the Mandelbrot set, but not as many for julia sets. This video sums it up, while the boundary of the Mandelbrot set is a map of a number of different julia sets, the julia sets are almost exactly self similar. If you pick 2 areas on a julia set, there is a function that will map one part exactly onto the other. This is true for the linear IFS fractals I’ve been writing apps for.
These maps don’t exist the same way for the Mandelbrot set, which seems strange when the algorithms for generating the images seem so similar. There is a fundamental difference between the two types of objects though. A julia set is defined by one single function and the different points in the image capture the behavior of a starting point. Each point of the Mandelbrot set corresponds to a function, and that to a Julia set. To do the standard rendering each Julia set is reduced to a single numeric value.
Now, this value hasn’t been chosen at random, but happens to answer a particular question. Is the Julia set of that function connected or is it a dust of disconnected specs? If we don’t care about that question, we can milk the rendering to get some more interesting fractal images. If we move the starting point, then the boundary of our new set moves accordingly. Instead of showing just barely touching Julias, it moves off center and some of the edges stray into the solid territory while others move into the dust realm.
I’ve put together some images using modifications I made to an HTML5 canvas renderer. (Link to my changes here) They show various alternate Mandelbrot sets generated from changing the starting position of the rendering. In further installments we can look at computing other ways to reduce the Julia fractals down to a single value for computing still other Mandelbrots. I’ll also cover generating Mandelbrot sets for the IFS fractals as well. That uses a more complicated algorithm.

")
These images show what happens when you go off script with the Mandelbrot. There are now pieces floating off the main island and large chunks are cut off at rough but boring boundaries. The transitional areas between the vast boring solid areas and the ethereal dusty areas contain a little burst of activity.
")
One of the early casualties is the symmetry and regularity of the Mandelbrot set.
")
")

")
