This is something that I just stumbled onto while working on something else. I’ve taken a quick break from the atomic orbital viewer. I’m trying to make the IFS fractals more visually interesting. One approach is to create Mandelbrot versions of the IFS fractals which should break up the uniformity. Instead of showing one image that is an exact copy of parts of itself, each part of it would be locally similar to a different fractal. The images I’ve been creating up until this point have all been analogs of Julia sets. I’m hoping the Mandelbrot versions will turn out more interesting. It also opens up the potential of higher dimension renderings as Mandelbrot sets exist in parameter space, not the actual fractal space.
Voronoi and a trip far afield
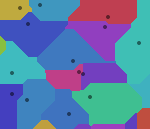
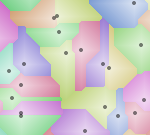
In order to do that, I need to estimate the “basin of attraction” for each mapping in the fractal. A voronoi diagram is one way to do that. I started out just generating standard simple diagrams as a test. Sometimes images are just the best way to see what is going on. Using a very simple algorithm, I just iterated through a list of random points and colored pixels based on the closest one. That meant I kept track of the minimum distance and the matching index. Which lead to renders of that distance, followed by the sine of the distance.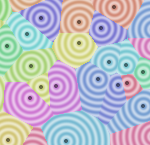
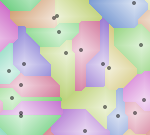
Now that I’m looking at alternate renderings, I figured the easiest way to find the borders of domains was to track the second closest point as well and whenever the distances between first and second point were equal you were on a boundary. That looked ok, but lead to some artifacts.
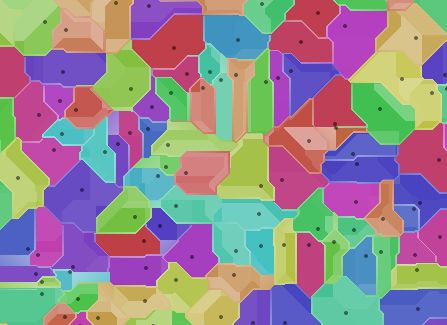
Now that I was collecting this info, I figured I’d try to do something else with it, so I applied it to the alpha channel and switched over to the taxicab metric just for fun.