A Random Walk Through Some Cellular Automatons
I wanted to investigate how closely various cellular automatons that differed by only one term were to each other, so I whipped up a demo that does a random walk through the parameter space of 1-d 2 bit automatons using a neighborhood of 5 pixels. This is the first one that popped up. 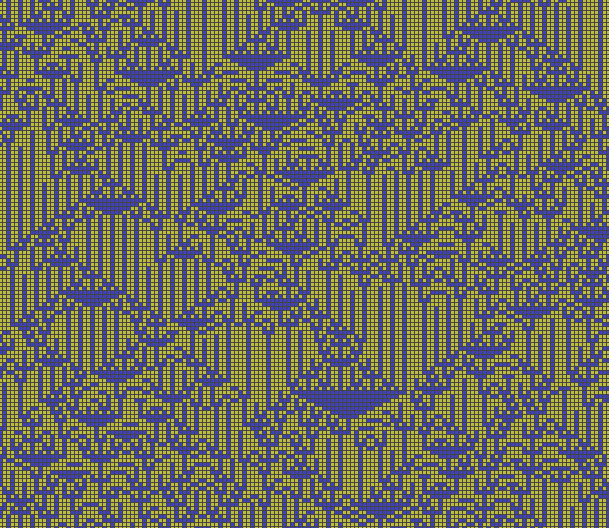 The next one is a automaton that differed by one parameter and is either off by one either above or below the example above.
 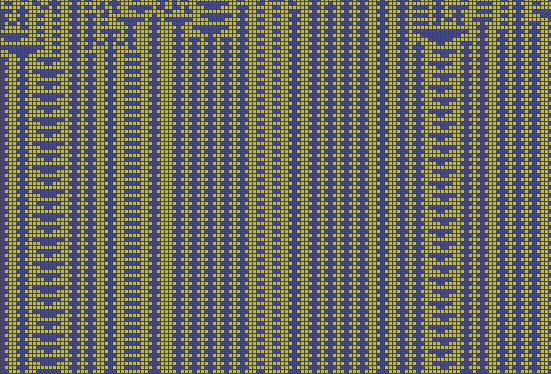 As you can see the result is much more regular and I would have considered it completely different, not a close neighbor of the previous rendering. Another step:
 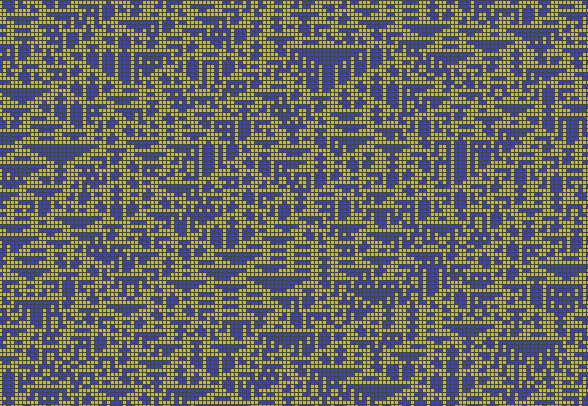 This is more interesting, but is another close neighbor of previous two. I decided to start over and in a little more controlled environment, I came up with these two.
 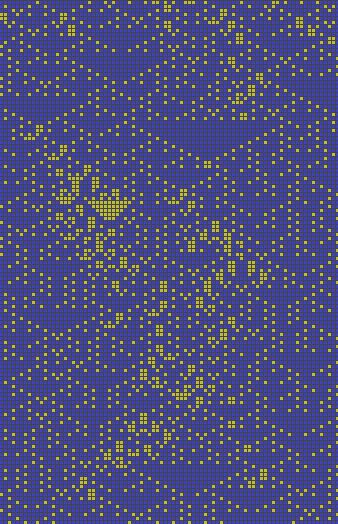 And one of it’s neighbors.
 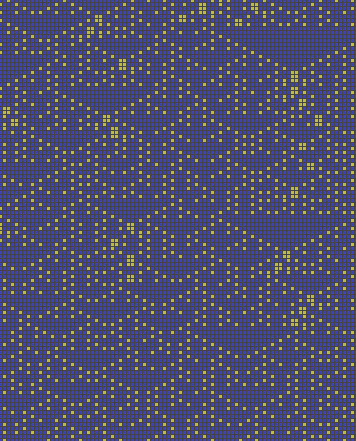 As you can see, this part of the space has more closely related images. It appears to be close to what I would have expected. The more “binary” you get with the 2 value spaces and smaller neighborhoods the less related the images are, and the larger the pixel and neighborhood spaces the more “continuous” the behavior becomes. That doesn’t mean that the hard boundaries go away, and I’m sure many measures of the resulting spaces have a self similar structure, which would be interesting to investigate in and of itself. My next plans involve, showing single pixel deviations in the initial state, and then building graphs of all the positions of the automaton spaces. I’d like to compare how the graphs change as you make the automaton space larger. I still have more predator prey stuff on the back burner too.